I’m using Tigergraph developer version on a Macbook Pro under Ubuntu Linux running in VMware Parallels Desktop Lite.
I have a favorite dataset of ASH dumps from a 4-node Oracle RAC database which I’ve used before for dataviz experiments and other purposes, so I thought I’d design a schema that could swallow a bunch of the data and I could run GSQL versions of queries I’ve done in standard SQL. The data are csv and I attached header lines to the files. They each have ~50K lines of data and about 30 data values per line.
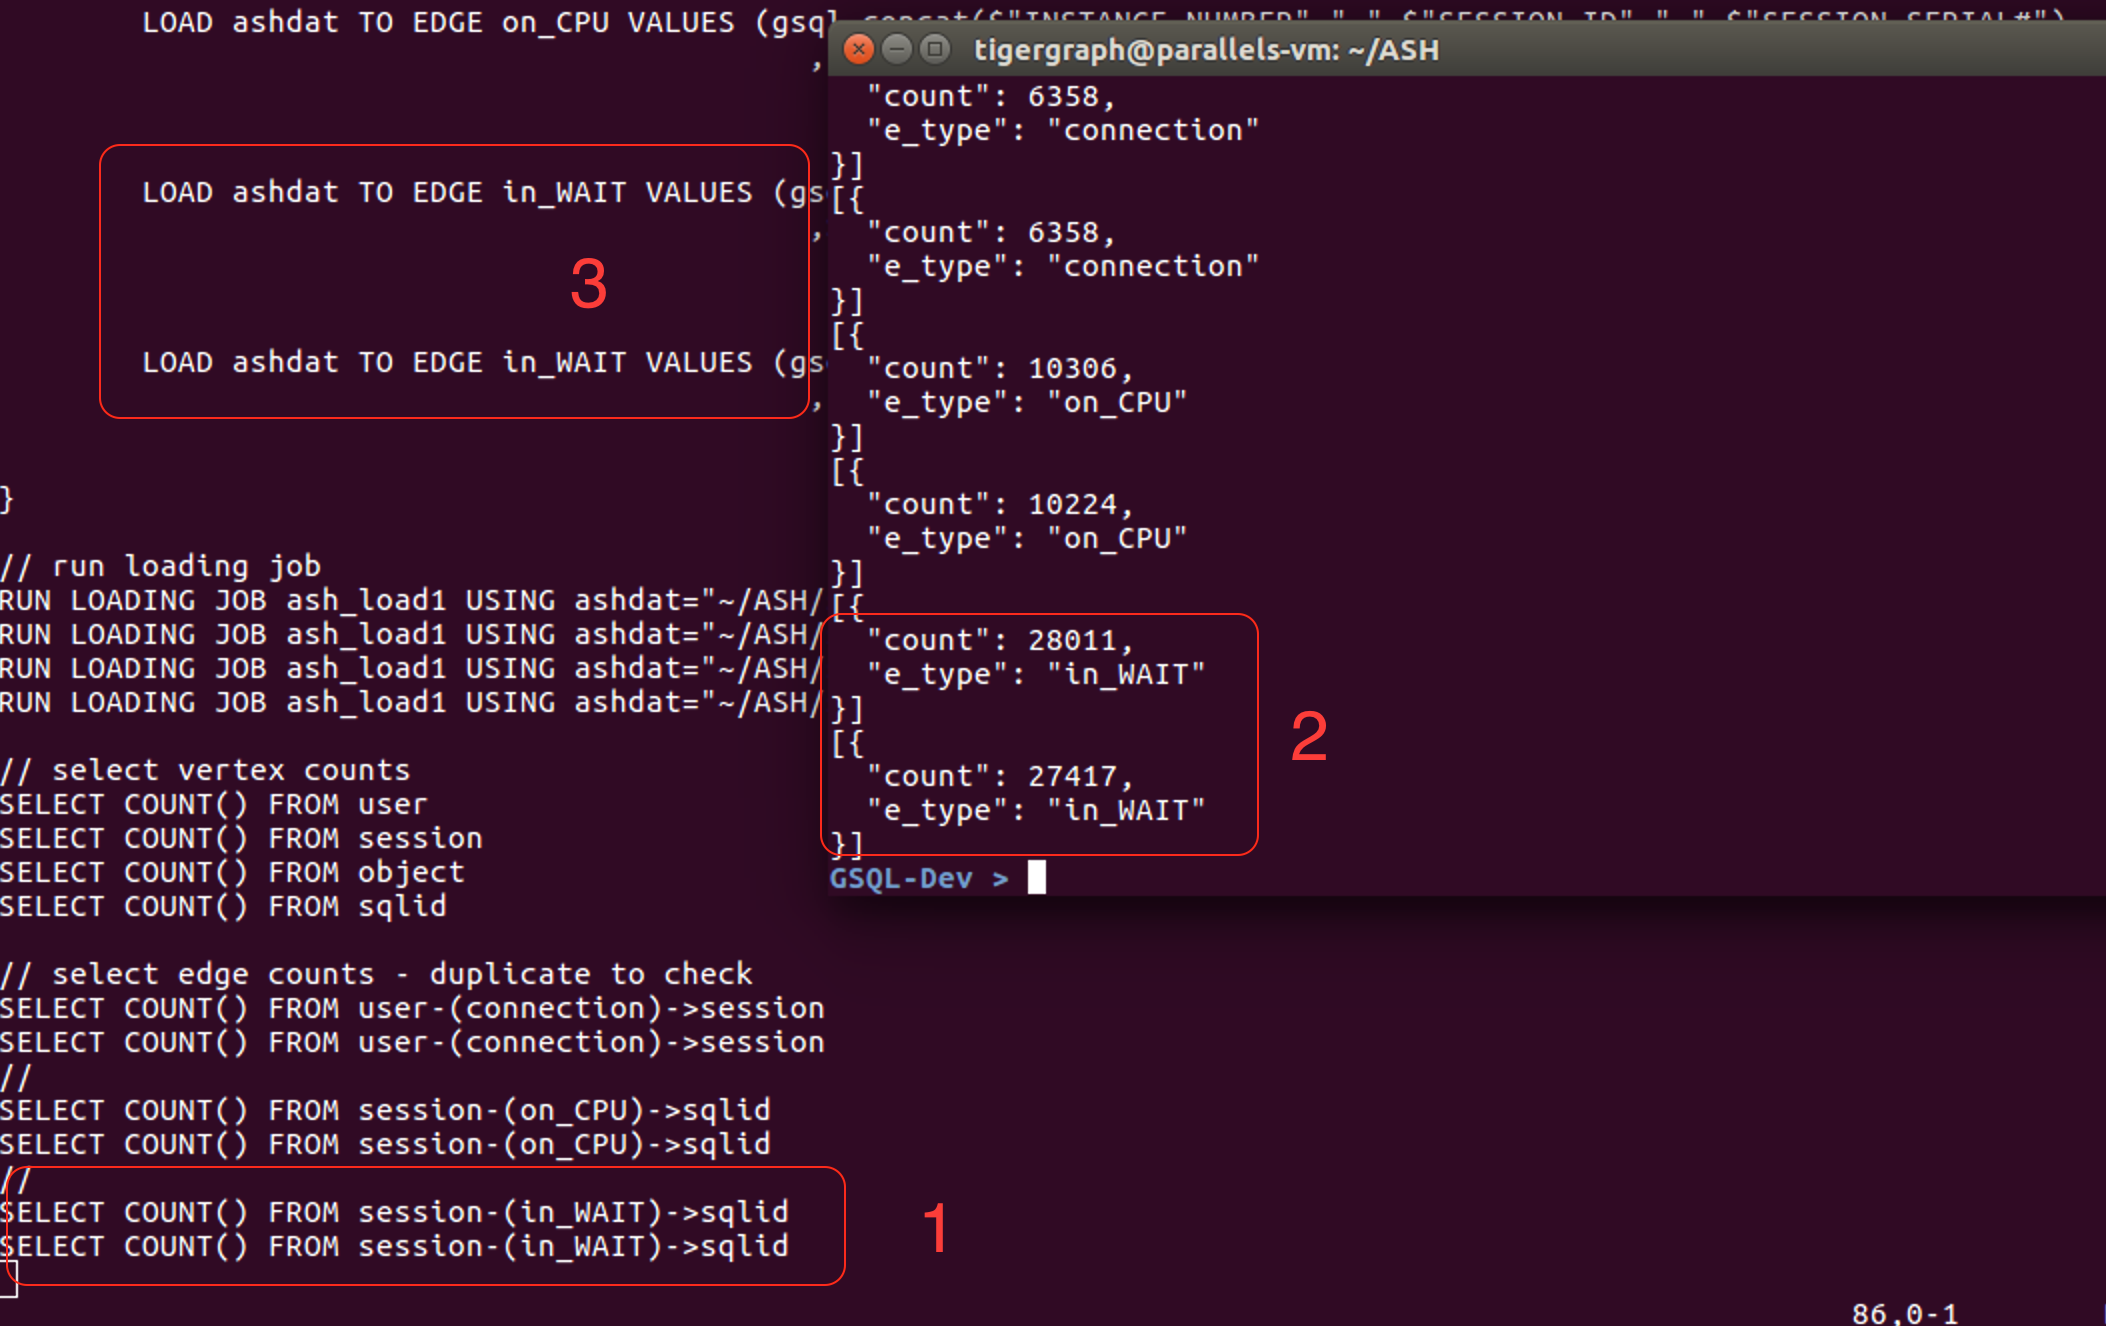
After getting my schema designed and the data load to work and before diving into complex GSQL queries I added simple “COUNT()” queries against the edge and vertex types in my schema at the end of the load job. While doing this using cut-paste I forgot to change edge types on one of the pasted COUNT() queries, i.e. my script executed the same count query twice consecutively. While noticing this I also noticed something very alarming, which is that the same count query executed twice consecutively gave two different answers. Of course this cannot be the case so now I wonder whether there is a wrong results bug here or if I completely misunderstand something, which seems unlikely given the simplicity of the test case.
Please see the attached screenshot with 3 terminal windows visible: 1/ the two count() query results for the “in_WAIT” edge type, 2/ the two count() queries, and 3/ the two load lines where this edge type are loaded.
Re: 3 the fact that two LOAD lines are used to load a single edge type should not affect the count() but seemed like perhaps it could be relevant (?)
Thanks for any insights. Very impressed with how fast and easily I was able to get my schema designed and data loaded. The GSQL doc seems quite good.
JB
Hi John,
Thanks for the detailed description. The result is not wrong and it is expected. The count is calculated from the disk data where it might fluctuate before our engine has persisted all the in memory updates from the loading. In this way, we got immediate response on the stat of count query. If you prefer an exact count and you can use any of the following two approaches and both calculate the exact count including the changes from latest updates. , i.e.
- use rest calls to the builtin query with realtime parameter as true.
curl -X POST “localhost:9000/builtins?realtime=true” -d ‘{“function”:”stat_edge_number”, “type”:”*”}’
where * means for all type of edges and you could specify one type of edge. Change “function” to “stat_vertex_number” will do the count for the vertex
If without real-time as true then it did the same count as GSQL coun()
- you have to write your own GSQL query to do the count.
Best Wishes,
Dan
Hi Dan -
Thanks for replying. I’m still a bit confused, pardon my lack of understanding the product.
So the COUNT() construct is not a “real” GSQL query? That is very counterintuitive coming from a relational background. And expectations are certainly for an exact result, so if it’s really an estimate or approximate value perhaps it would be better named to indicate such?
So when the load job “finishes” if all data is not persisted what is the case when a cluster node fails after load indicates success and before full persistence? Seems like client will think all data is in database but that not the case. Is there default replication in place to mitigate? What replication factor (2,3?) and can it be adjusted?
Can database be placed into “real time=true” for all queries through some configuration parameter?
Is there documentation where these “under the covers” aspects of the product can be learned? I didn’t find on web site.
Thanks!
JB
Hi John,
In our engine, we have the support for data persistence. Our engine guarantees that all committed data (once the post got successful response from the engine, or the loading is done) is persisted in our database. We also have HA support in the enterprise version to deal with machine failures.
This is different from that engine persisted the updates into the disk data that used in the count(). We make the count() work this way is because when you have very large data updates the realtime calculation of count is very time consuming and therefore we make it approximate rather than exact up to date.
The count() is actually calling the builtin api of our engine to do fast approximately calculation (use the not up to date stat data). Yes, the current design of count() is a little bit of confusion. In the future version, we might make count(*) as the one calling with parameter realtime as true and keep count() as approximate count.
The under the covers materials are still under the review and we will post them in the future either as the format of user documents or in the engineering blogs.
Best Wishes,
Dan