Hello Team,
Can we able to check the query explain plan like Relational database.
Also do we have any query history table, where we can see all query performances analysis .
Thanks,
Parshva Fadia
Hello Team,
Can we able to check the query explain plan like Relational database.
Also do we have any query history table, where we can see all query performances analysis .
Thanks,
Parshva Fadia
Hi @Parshva007 ,
I don’t believe we have a “query explain plan” feature in TigerGraph yet.
As for the query history table, you should be able to see the performance of the past queries within 3 - 5 minutes using the Query page: Queries :: GraphStudio and Admin Portal
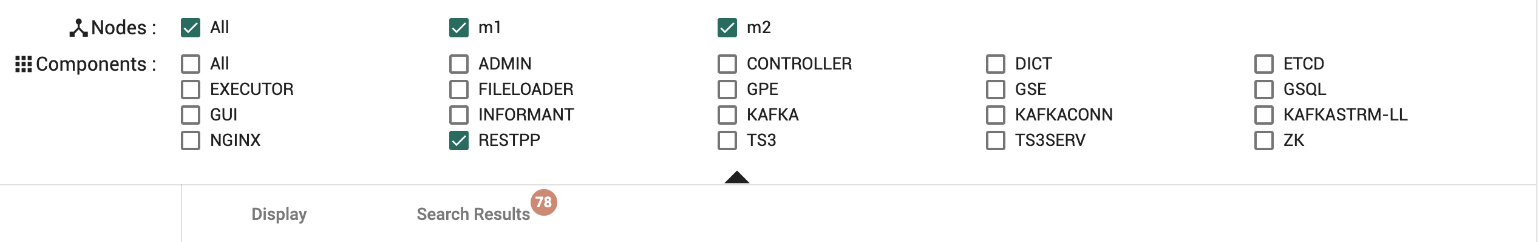
If you want to see historical performance, you can check the logs. Try to search the logs page for the RESTPP component with the query name - you would be able to see the query runtime there: Logs :: GraphStudio and Admin Portal
If you want to see the query flow (e.g. like how many vertices got activated by a SELECT statement), please see this instruction here: Troubleshooting Guide :: TigerGraph DB
I hope this helps! Please let us know if you have any further questions.